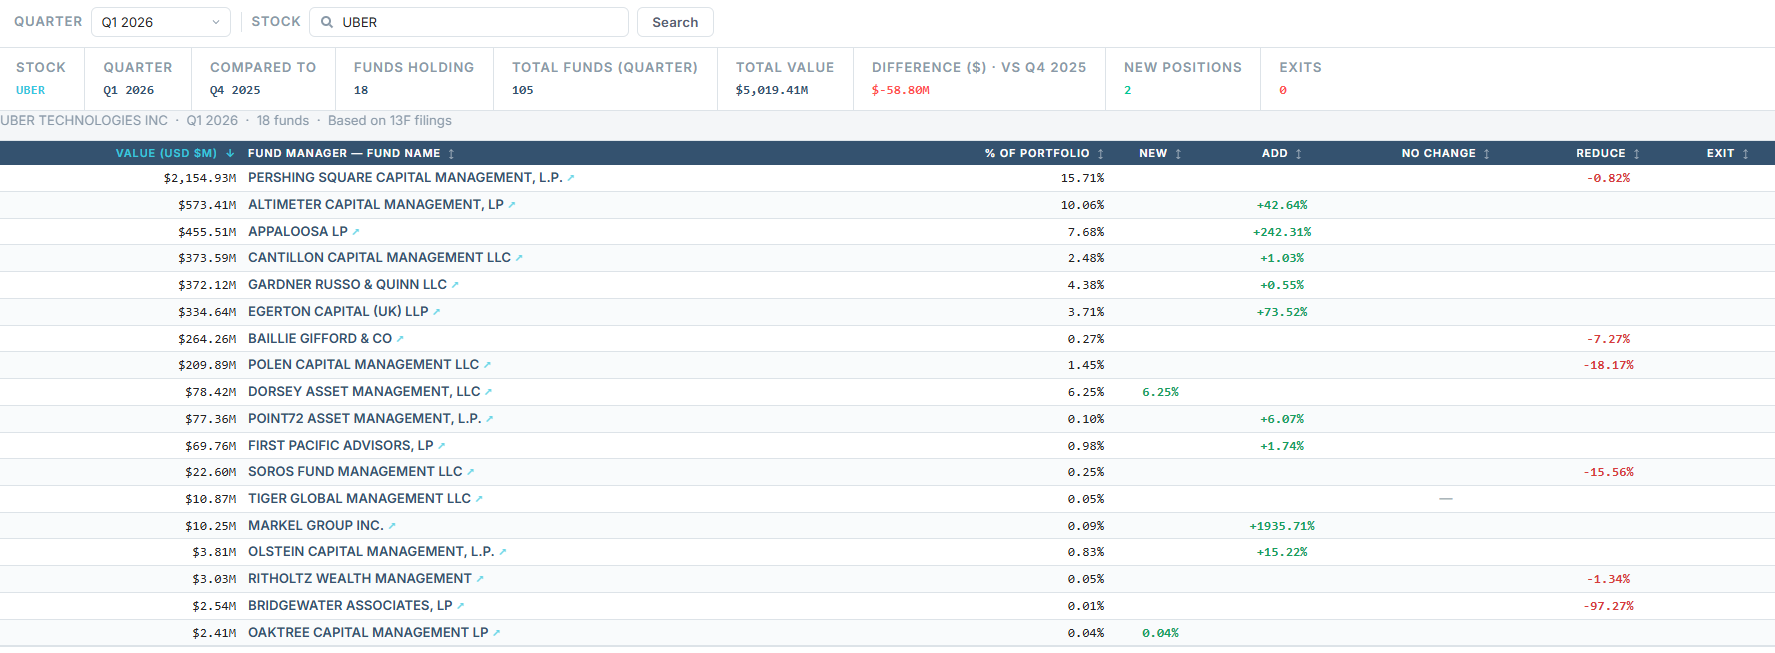
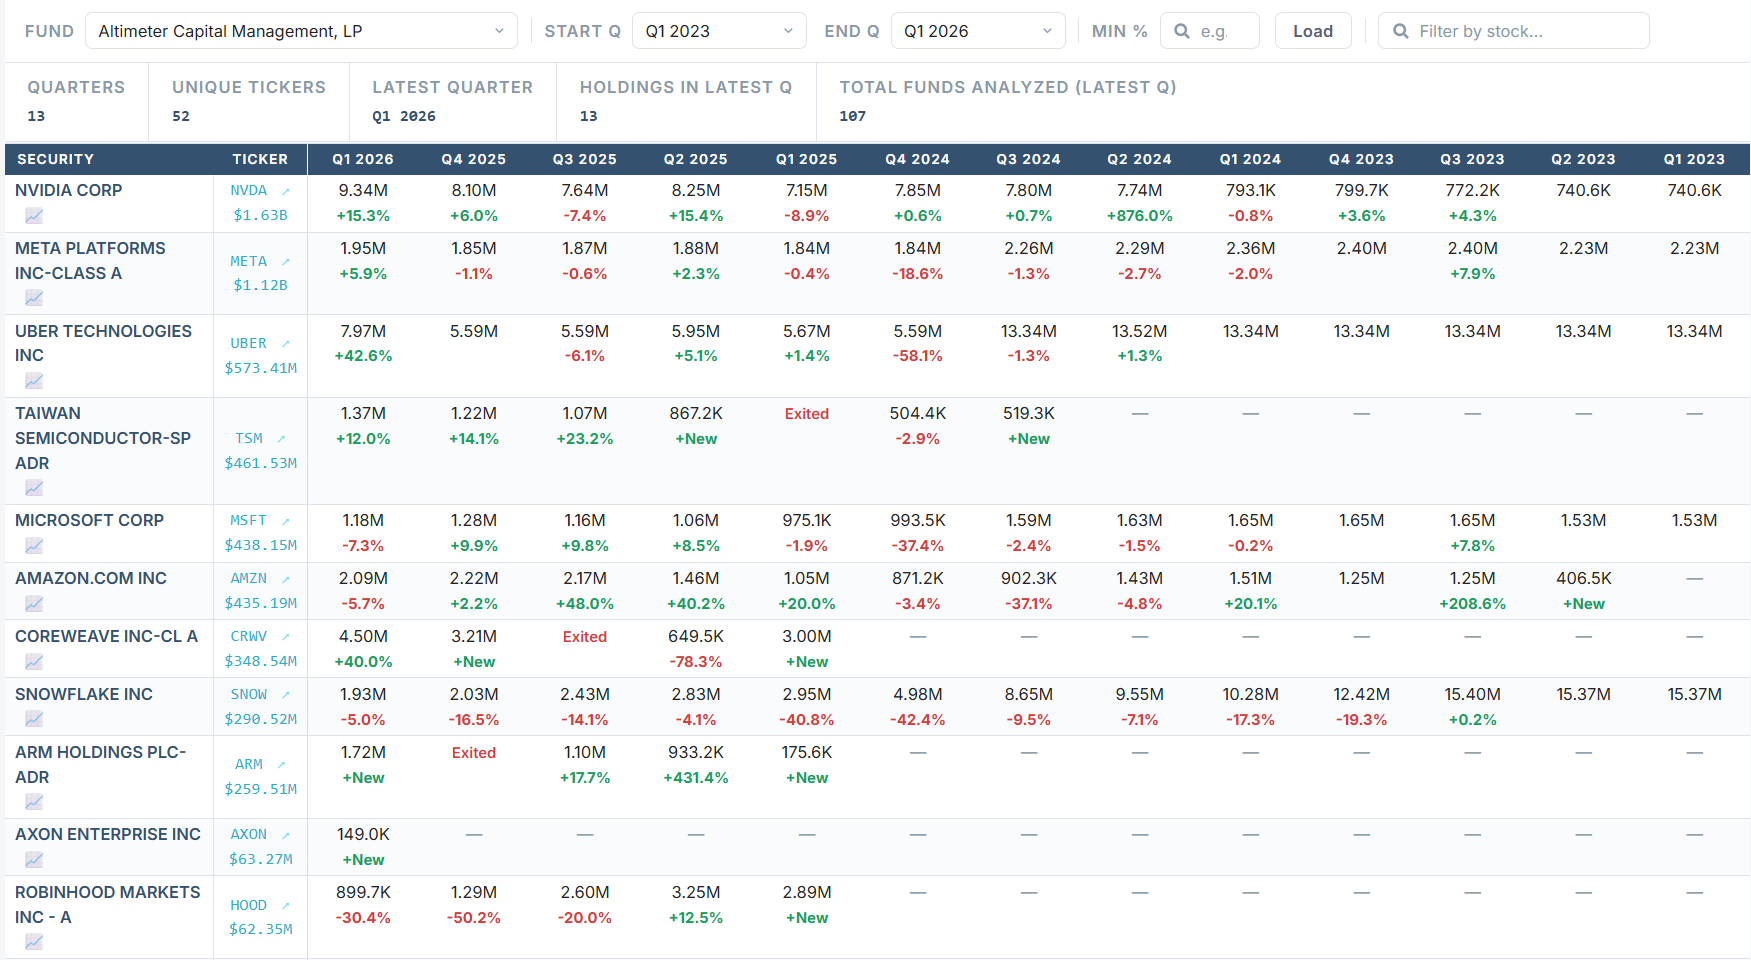
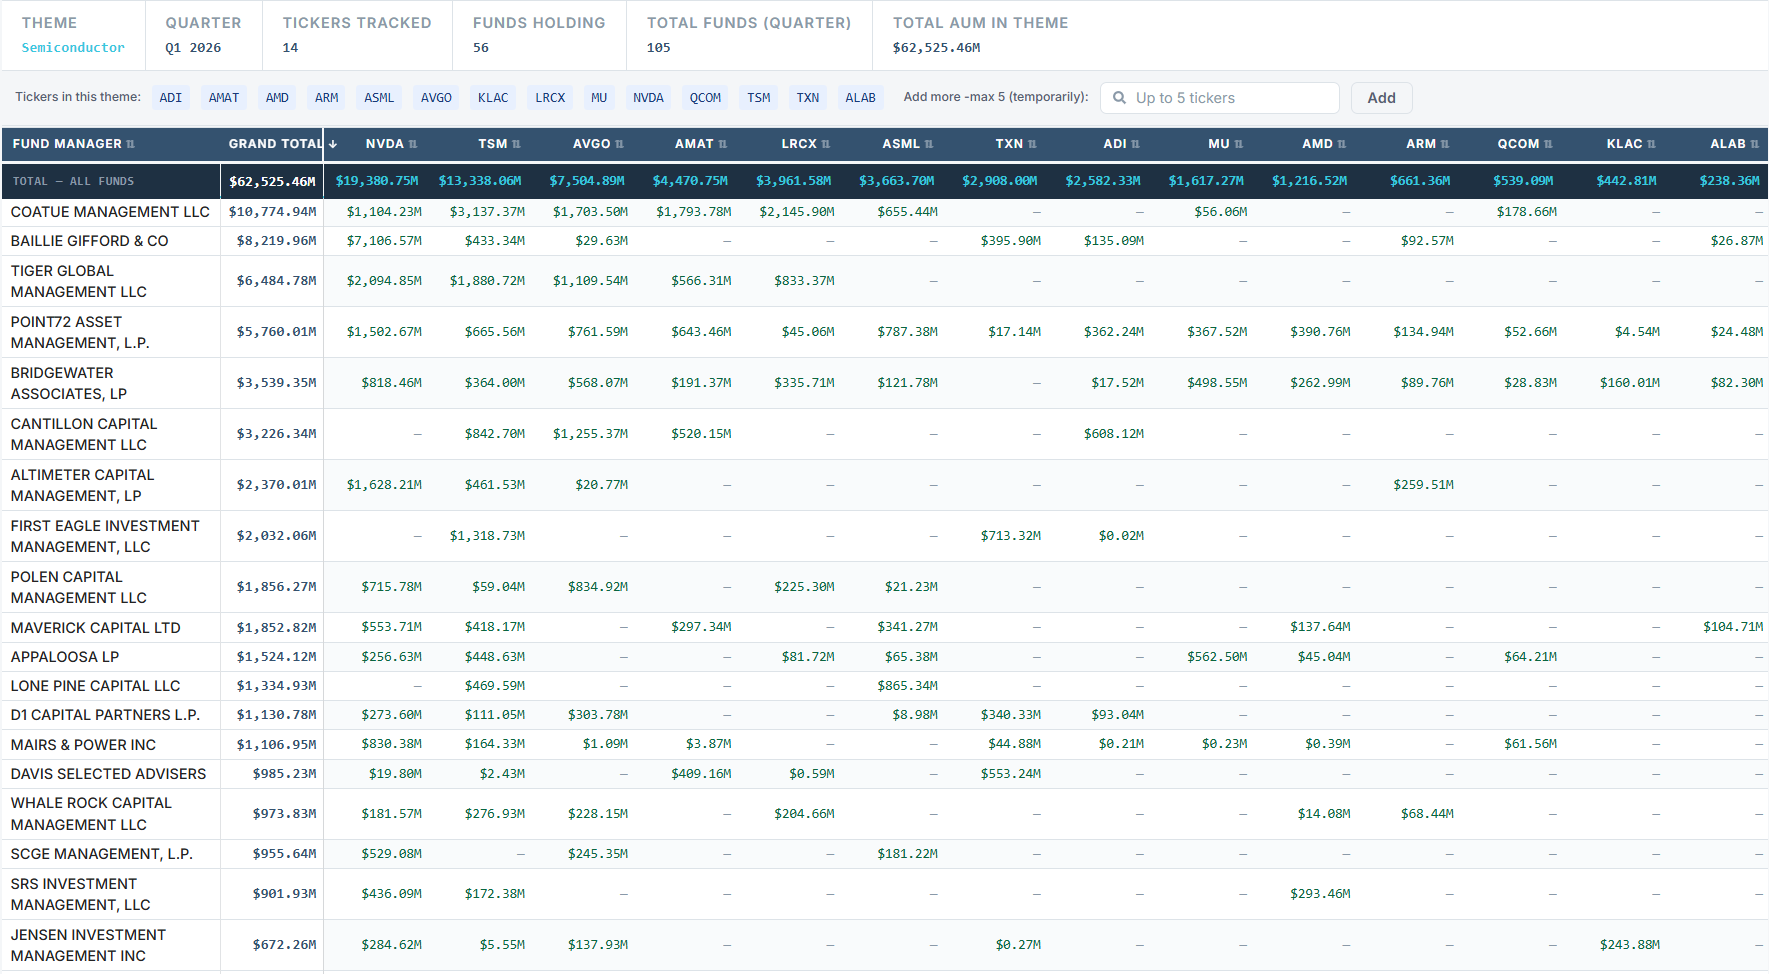
Research any ticker like a fund analyst — in 10 seconds.
Type a ticker. Get an institutional-grade research report on a single page: a 1–10 Business Quality Score, 15 years of financials, a Reverse DCF, insider activity, the latest earnings analysis, and pricing models. No tabs. No clicks. One scroll.
One ticker. Eight sections. Every answer that matters.
Snapshot · Business Quality Score · 15-year financials with comparison charts · Cash returns · Balance sheet risk · Insider activity by window · Reverse DCF + multiples-based pricing models · Latest earnings analysis. Everything Yahoo, Seeking Alpha, and Simply Wall St make you click through tabs to find — laid out in the order you'd actually read it.
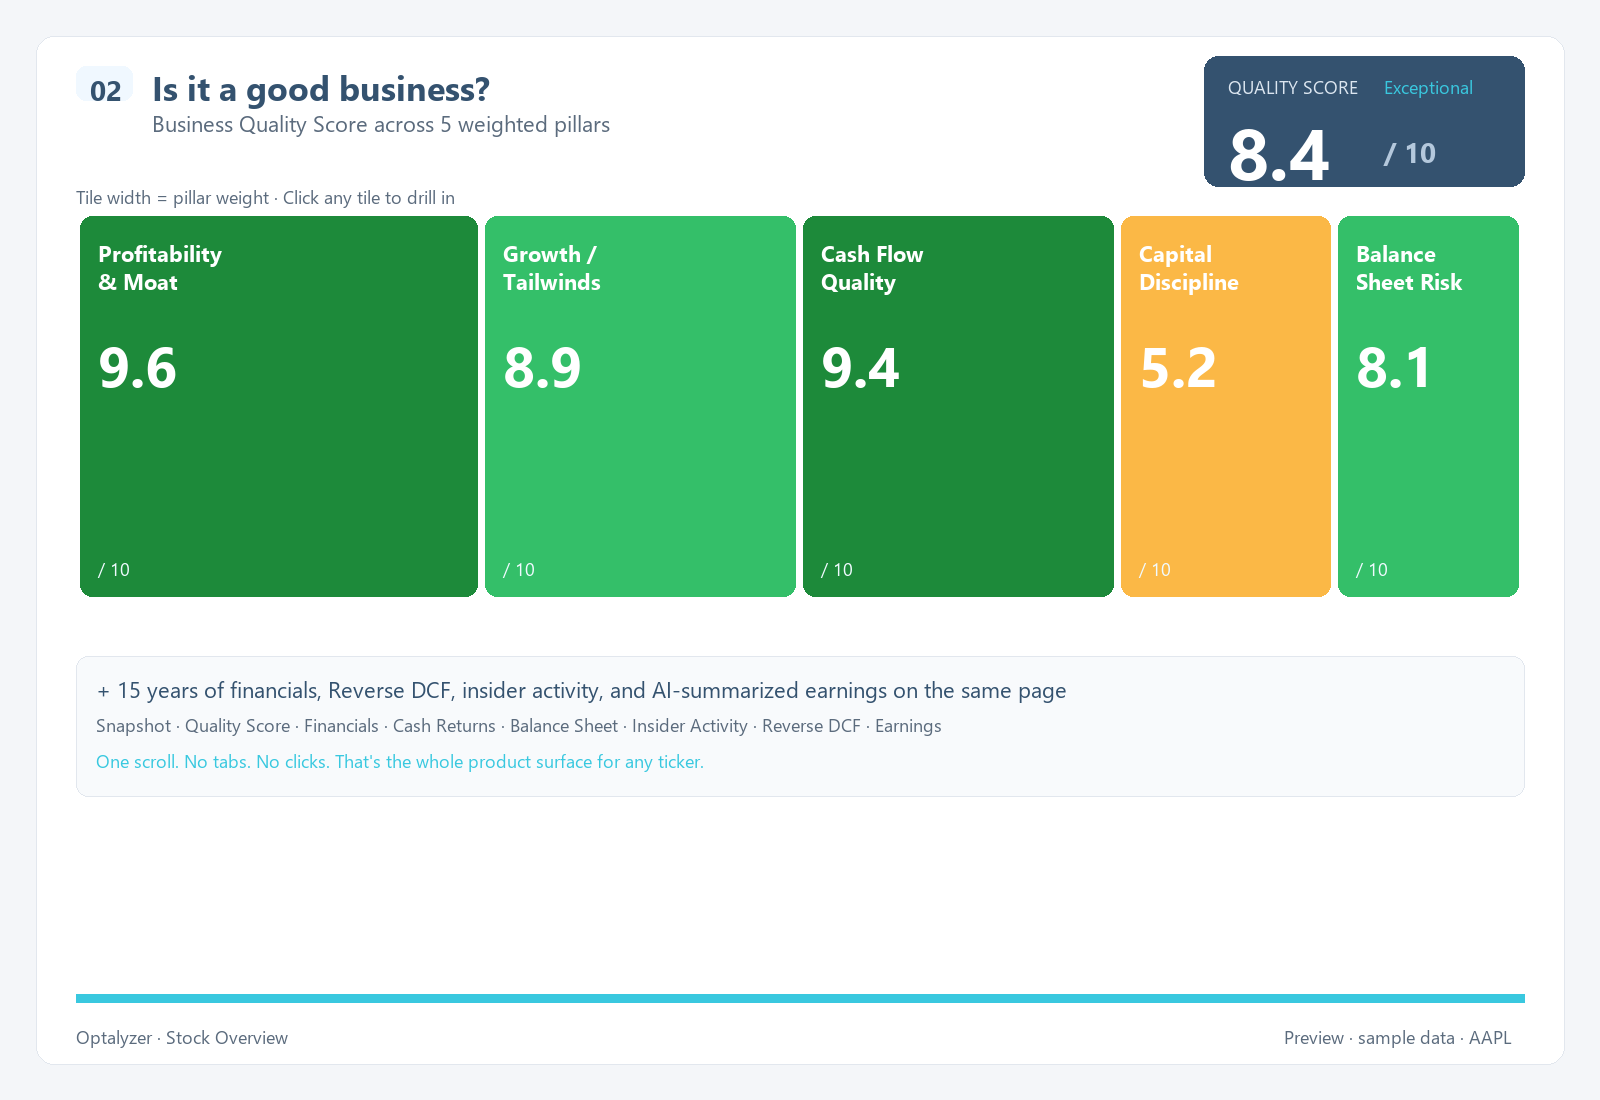
Business Quality Score (1–10)
A proprietary score across five pillars — Profitability & Moat, Growth, Cash Flow Quality, Capital Discipline, Balance Sheet Risk. A treemap shows you which pillars are weak at a glance, not just a number to memorize.
Proprietary scoring15 years of financials, one scroll
Revenue, margins, cash flow, share count, debt — quarterly or annual — with YoY, 3-year and 5-year CAGRs already computed. Most retail tools cap at 5 years. We go to 15 so you can see how a business behaves through a full cycle.
Deeper historyReverse DCF, not the usual kind
Instead of guessing a fair price, we ask the more useful question: what growth does today's price actually imply? Compare that to analyst consensus and the company's own track record. A valuation tool built for traders, not academics.
Trader's edgeEarnings Analysis & Insider Flow
The latest quarter's earnings call distilled into an executive summary you can read in 60 seconds, plus Form 4 insider buys/sells aggregated across five time windows (3mo / 6mo / 12mo / 3yr / 5yr) with red/green bars. Two screens most tools never bother to build.
Built for speedResearch like a fund analyst, in the time it used to take to load a quote.