Key Points
The put credit spread is a bullish options trading strategy with pre-defined maximum loss . It is comprised of a short put and a long put , and is sometimes also referred to as a “bull put spread” or “short put spread”
Trade
- Sell 1 put ATM or OTM –> This is short put leg
- Buy 1 put further OTM from short put –> This is long put leg
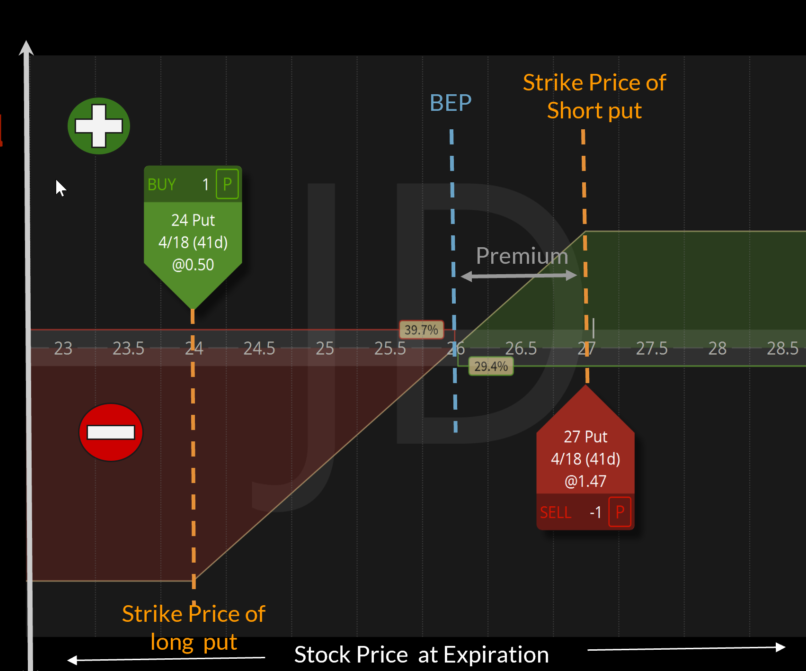
Trade Example
Stock XYZ is trading at $27 a share.
– Sell 27 put for $1.47
– Buy 24 put for $0.50
– The net credit received for this trade is $0.97
Width of spread : $27-$24 = $3
Profit & Loss Diagram

Best Case : The best case scenario for a put credit spread is for the underlying instrument to stay higher than strike price of the short put leg
Worst Case : The worst case scenario for put credit spread is for the underlying instrument to go lower than the strike price of the long put leg
Put Credit Spread Summary
| Maximum Profit | Limited |
|---|---|
| Maximum Profit Scenario | Stock is at or higher than the strike price of the short put leg |
| Maximum Loss | Limited : Width of spread – Initial Premium |
| Maximum Loss Scenario | Stock is higher than the strike price of long call leg |
| Why Trade | It caps the maximum loss It uses less buying power as compared to a naked short put |
| When to Open | Stock Outlook : Bullish Volatility : High so you can get higher net credit |
| When to Close | When the trade is making 50% of the max profit potential |
| Legs | 2 legs |
| Passage of time | Positive impact on trade With passage of time, the value of this option spread decreases |
| Increase in volatility | Negative impact on trade With increase in volatility, the value of option increases |